Usage and resources#
Two screens answer "what are my agents consuming?": Stats for tokens and cost, Resources for CPU, memory and disk on the computer. Both open from the menu and show the current server only; Mewla never adds several computers together.
Stats#
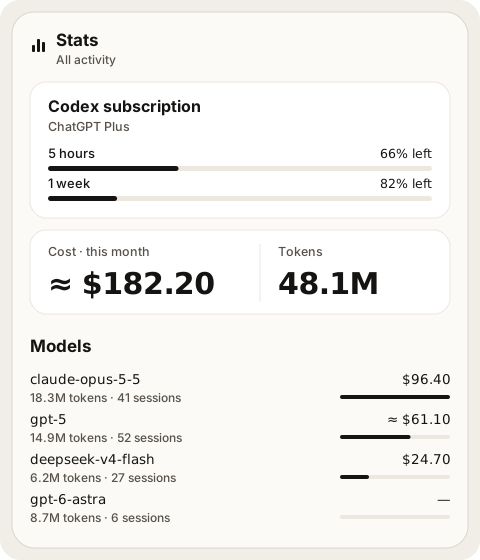
Stats reads the agents' own history on the computer and shows, per model, tokens, sessions and cost for the range you pick. Tap a model for input, output and cache tokens, the price source and when it was refreshed.
Costs come in four kinds, kept apart:
| Kind | Meaning |
|---|---|
| Reported | The agent's history recorded an actual charge |
| Estimated | Priced from a public reference price list; marked ≈ |
| Mixed | Part reported, part estimated |
| Unknown | No known price; shown as —, never as zero |
Estimates use public reference prices; your provider or gateway may bill differently.
When Codex is signed in with ChatGPT and uses Official login, Stats also shows the plan's usage windows (for example 5 hours and 1 week) with the share left.
Per agent:
- Claude Code: read from
~/.claude/projectsevery five minutes, including traffic through a Custom Gateway. Costs are reference estimates, not your subscription bill. A customCLAUDE_CONFIG_DIRis not read. - Codex: each request is priced at its own context size, so long-context tiers apply per request.
- OpenCode: read from OpenCode's local database.
Resources#
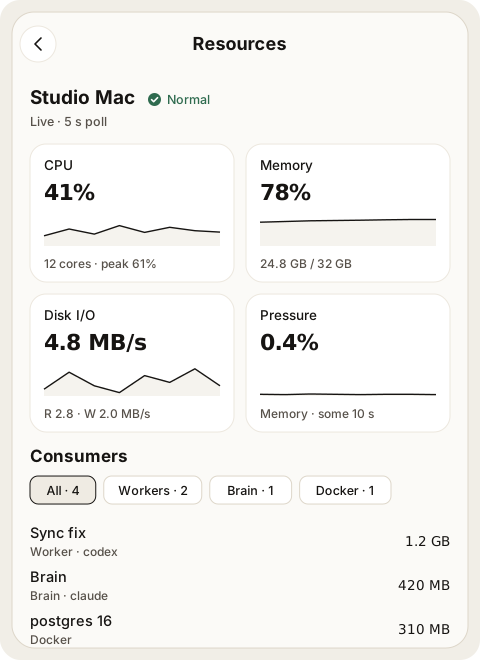
Resources is a live view of the computer, refreshed every five seconds while it is open:
- CPU, Memory, Disk I/O and Pressure cards, each with the last minutes of history. Pressure is Linux PSI. Details adds per-core activity, load averages, cache and swap, mount space, and PSI averages.
- The pressure state (normal, elevated or critical) and the signals that crossed a threshold.
- Consumers: processes grouped by owner (Workers, Orphaned Workers, Brain, Docker, User), sorted by memory (RSS) or CPU. Tap one for its command, folder and process list. An orphaned Worker shows Residual next to its last status.
When pressure turns elevated or critical, Brain is told and decides what to do, such as waiting before it starts more Workers or closing one. Mewla itself never kills or throttles a process.
A state change needs 20 seconds of sustained pressure. To change a threshold,
put the values you want in ~/.mewla/resource-telemetry.json; it is reread on
every sample, no restart needed:
{
  "available_memory_percent": { "elevated": 15, "critical": 7 },
  "cpu_busy_percent": { "elevated": 90, "critical": 98 },
  "disk_free_percent": { "elevated": 10, "critical": 3 }
}
If the connection drops, the last sample stays on screen marked Last sample.